Pokémon vs MTG
Two collectible TCG asset classes side-by-side. Aggregates roll up across the platform's tracked eras and sealed products,
benchmarked against the S&P 500 Total Return. Card universe coverage from pokemontcg.io (Pokémon) and
scryfall (MTG); no scraped data, no fabricated rates.
Game A Pokémon 8 eras tracked · 20,146 cards
vs Game B Magic: The Gathering 5 eras tracked · 38,507 cards
| Metric | Pokémon | MTG |
|---|---|---|
| Tracked cards Total card universe in the platform's index — not market cap. | 20,146 | 38,507↑ |
| Cards with priced raw market Coverage at the card-price level (pokemontcg.io / scryfall). | 19,586 | 37,876↑ |
| Tracked eras (with products) | 8 of 10↑ | 5 of 7 |
| Tracked sealed products | 98↑ | 61 |
| Sum of basket values today Sum across each era's tracked basket — not the game's total market cap. | $1.21M↑ | $49,454 |
| Sum of MSRP invested | $9,015↑ | $5,889 |
| Avg basket CAGR across eras | +34.8%↑ | +12.4% |
| Avg alpha vs S&P 500 across eras | +25,777 pp↑ | +1,979 pp |
| Best-alpha era | WOTC Era (+66,139 pp) | Vintage Era (+6,711 pp) |
| Best-CAGR era | Black & White Era (+51.2%) | Universes Beyond Era (+18.8%) |
Index snapshots
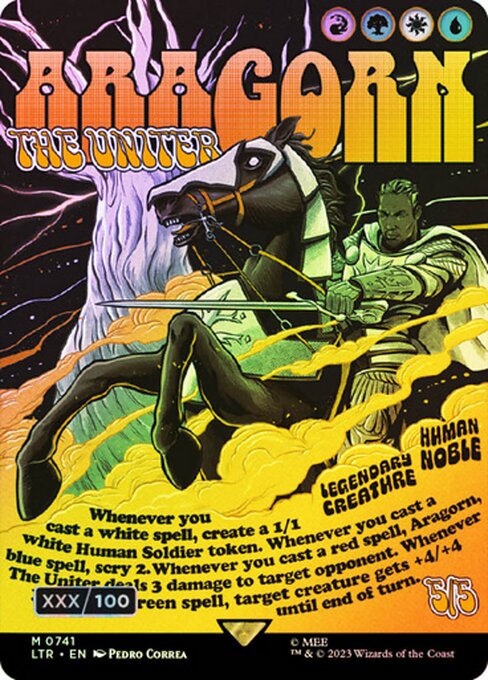
Top cards by raw market price
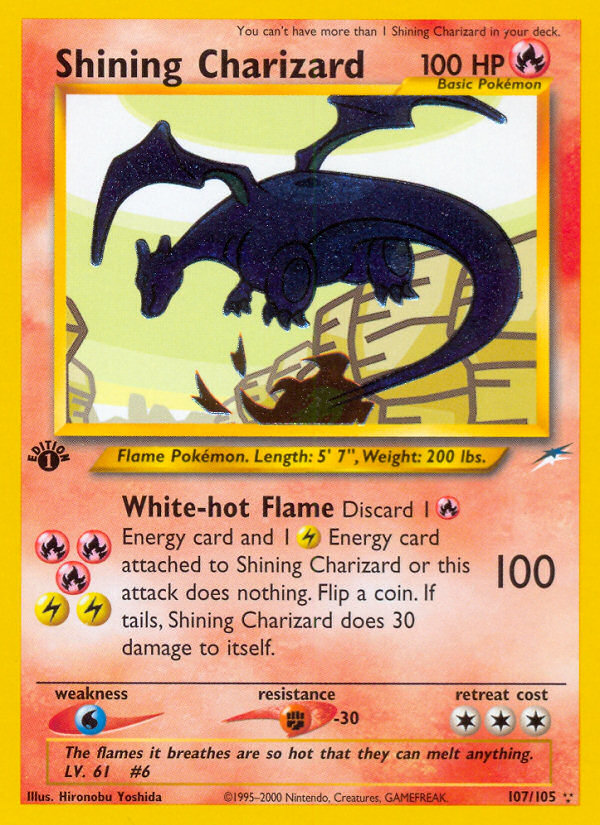
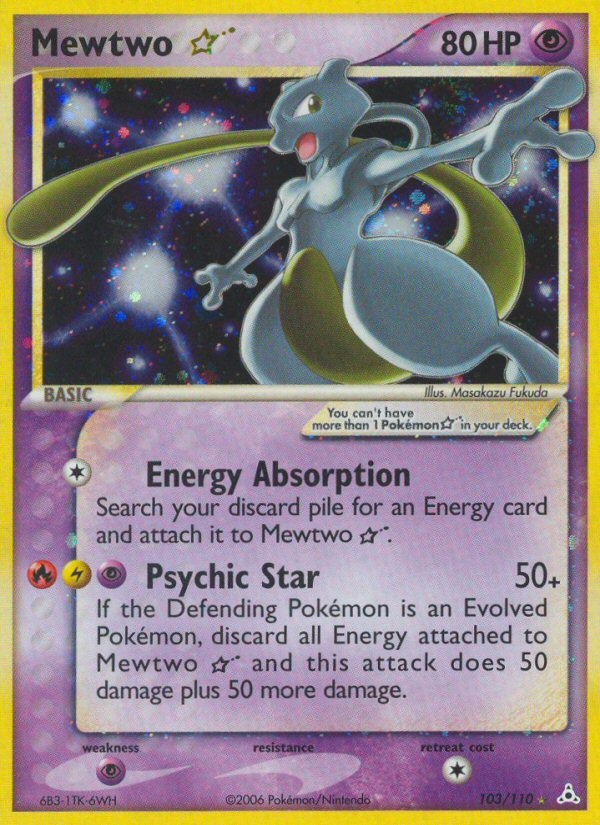
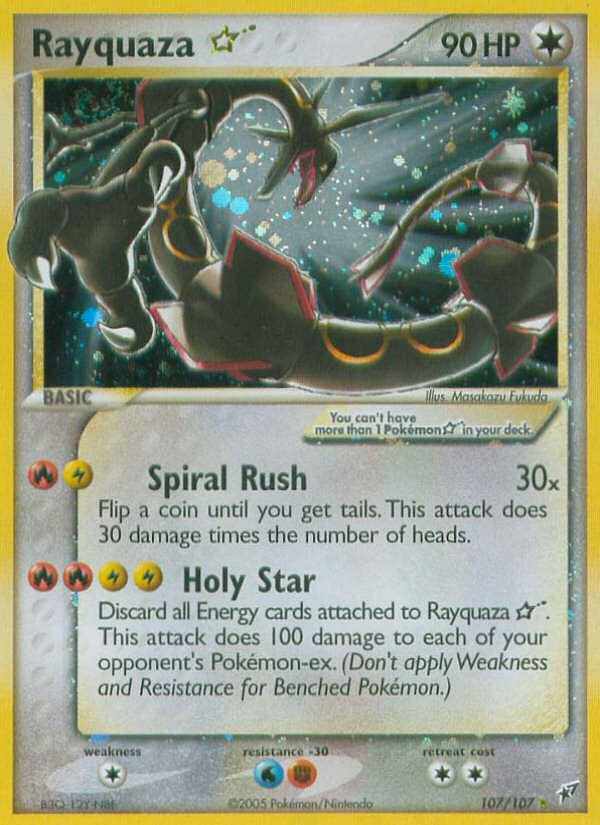

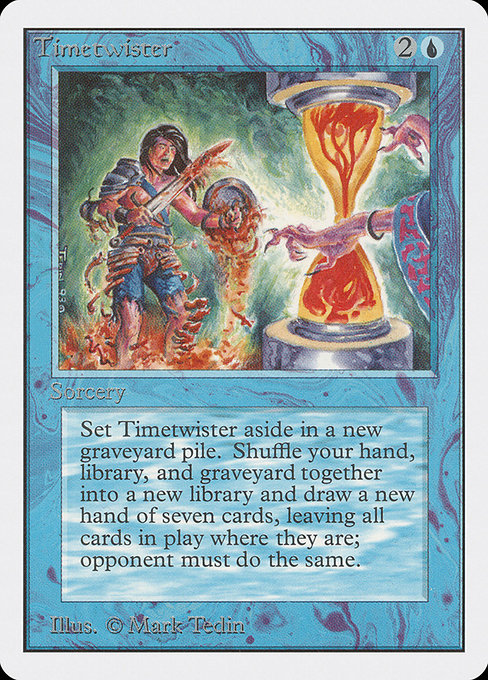
Data quality & transparency
- Pokémon coverage: 19,586 of 20,146 cards have a tracked raw market price (via pokemontcg.io's TCGplayer feed).
- MTG coverage: 37,876 of 38,507 cards have a tracked raw market price (via scryfall's TCGplayer feed).
- Pop reports: No verified PSA/CGC/BGS/SGC pop counts on either game. Plays surfaces use seed pop-velocity data labeled with BETA chips until a universal pop source lands.
- S&P benchmark: Total Return series (
^SP500TR) via Yahoo Finance, daily.